Kernel Debugging with Windbg and IDAPro - Windows 10 target
Setup
Requirements


- Two machines, a host and a target
- The host is where IDA Pro is installed
- The target is a Windows environment that you plan to debug
- IDA Pro must have Windbg debugger (https://hex-rays.com/) I guess the free version doesn't have the Debugger feature.
- Windbg should be installed at the target (https://docs.microsoft.com/en-us/windows-hardware/drivers/debugger/debugger-download-tools)
- it would be best to install the Windows symbols along with Windbg (https://developer.microsoft.com/en-us/windows/hardware/download-symbols)
Quick Steps
In the target, open a command console but run as Administrator then execute this line:
bcdedit.exe -set debug on
For Windows 8/10, remote debugging can be done via network:
bcdedit.exe -dbgsettings net hostip:xxx.xxx.xxx.xxx port:50000
where xxx.xxx.xxx.xxx is the ip address of the host. The port can be changed as preferred.
Remember to take note of the key.
Debugging a 64-bit kernel code may require you to enable testsigning. Just execute this line:
bcdedit.exe -set testsigning on

In the host, open IDA Pro, then go to Debugger->Attach->Windbg debugger.
The content of the connection string should be in this format:
net:port=<port number>,key=<enter_key_here>
For example, the connection string will be: net:port=50000,key=3tjz38motf68d.36r79l1ivswtl.3g53stk92axbx.1y1tuvx0f0pb4
Click the Debug options button then click on Set specific options. Select Kernel mode debugging with reconnect and initial break.
You can choose which output flags you prefer.
In the Debugger setup window, you can choose the events you wish to make the debugger break. You can set this up again if you prefer to manually load the driver.
Debugging
Restart the target machine to apply the debug configuration.
If you plan to debug from when Windows loads, you can start debugging with IDA Pro
You may encounter these messages if the setup was a success.

Just select <Kernel> and click OK in the modules box.

It may take some time before everything loads. Take a coffee break. By the time come back, the instruction pointer will leave you to a debug break.
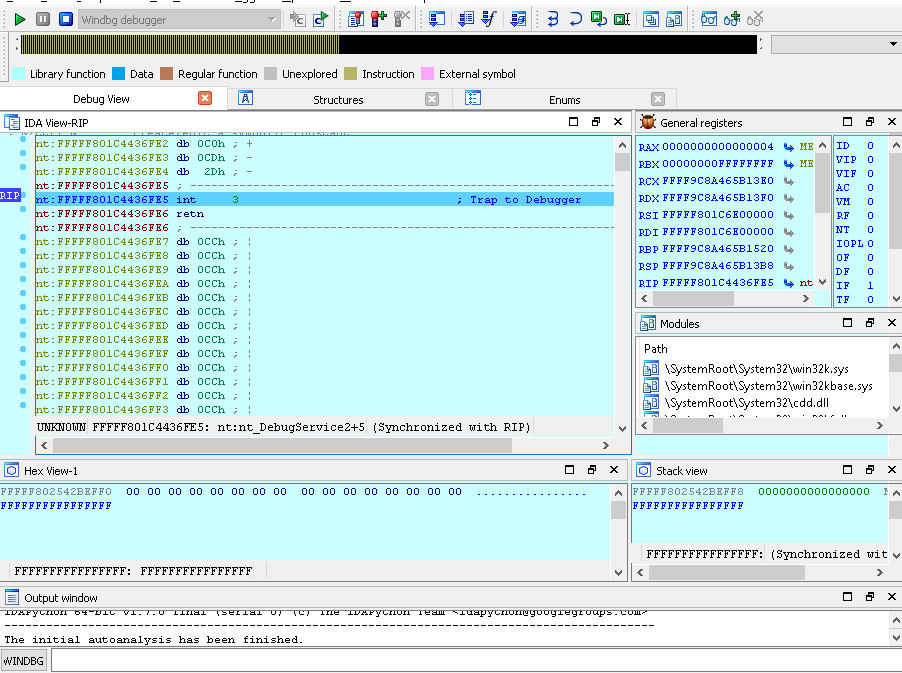
With the target at a suspended state.
While in the debugger, you can view the loaded modules and set breakpoints there. You can view physical memory dumps using the WINDBG command line.
